Difference between revisions of "Line Stats"
(note on date) |
|||
| Line 33: | Line 33: | ||
# Click on 'Statistics' | # Click on 'Statistics' | ||
# Click on 'ADSL' | # Click on 'ADSL' | ||
===SmartRG 505N=== | |||
[[File:SmartRG505N Line stats.JPG|thumb|right|Line stats displayed on a SmartRG505N modem]] | |||
# Log into the web interface of your modem ([[DSL modem web interface|how to log in]]) | |||
# Click on 'Device info' | |||
# Click on 'Statistics' | |||
# Click on 'xDSL' | |||
==Your NCF stats== | ==Your NCF stats== | ||
Revision as of 15:53, 23 August 2017
Your DSL modem continuously monitors the quality of your DSL service. You can obtain line statistical information from your modem to assess the quality of your line and service.
Bell is responsible for the quality of your line and it is worth noting that most of your monthly payment to NCF goes to Bell to provide DSL service on your line.
How to obtain the line stats from your modem
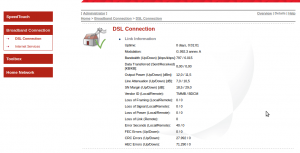
SpeedTouch 585 or 516v6
- Log into the web interface of your modem (how to log in)
- In the left column, click on 'Broadband Connection'
- In the left column, click on 'DSL Connection'
- In the top-right area, click on 'Details'
Depending on your modem model and configuration, the numbers may be displayed with commas and periods in the European manner, which is the reverse of what is common in North America. For example: 1,000.12 for 'one thousand decimal 12' may be displayed as '1.000,12'.
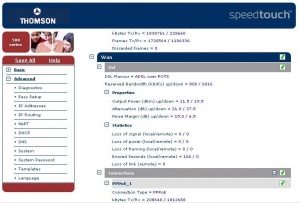
SpeedTouch 516v5
- Log into the web interface of your modem (how to log in)
- In the left column, click 'Advanced'
- Below that click 'Diagnostics'
- Above click the + sign beside 'Expand All'
- Scroll down to the section 'Wan' ... 'Dsl'
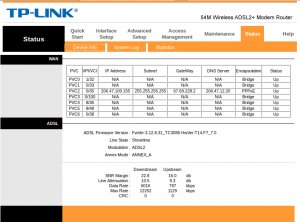
TP-Link 8816, 8901G or 8951ND
These models of TP-Link modems all have similar interfaces:
- Log into the web interface of your modem (how to log in)
- Click on 'Status'
- Click on 'Device Info'
TP-Link 8950ND
- Log into the web interface of your modem (how to log in)
- Click on 'Device info'
- Click on 'Statistics'
- Click on 'ADSL'
SmartRG 505N
- Log into the web interface of your modem (how to log in)
- Click on 'Device info'
- Click on 'Statistics'
- Click on 'xDSL'
Your NCF stats
You can see your stats as seen by NCF here. Note the date on that page that says when they were collected.
How to interpret the line stats
Bandwidth
It is normal and good for bandwidth down to be about tens times the bandwidth up. You can confirm this number by doing a speed test.
Line Attenuation
Attenuation is a measure of how strong the signal is from the Bell office ('DSLAM'). Note that Lower is better as it indicates less attenuation.
| Attenuation (dB) | Rating |
|---|---|
| 0 to 40 dB | Excellent |
| 40 to 50 dB | Good |
| 50 to 60 dB | Fair |
| > 60 db | Poor |
Signal-to-Noise Ratio (SNR or SN Margin)
Signal-to-Noise is a measure of noise on your line. Too much noise can obscure the DSL signal. Higher is better as it means you have more signal than noise.
| Signal-to-Noise (dB) | Rating |
|---|---|
| > 20 dB | Excellent |
| 10 to 20 dB | Good |
| 6 to 10 dB | Fair |
| 0 to 6 db | Poor |
Errors
The error figures are an indication of how many packets had to be retransmitted because they contained an error and is caused by line noise. The error counts are cumulative since the time DSL sync was last obtained. To reset the error counts, do a software restart of your modem, or power cycle your modem, or disconnect your DSL line for a minute or two.
The significance of error counts is unclear and may not be significant. Some modems may misreport errors and even with errors, your service may be fine.


